This is one of a series of columns that were produced for Moneyweb Investor in which Stuart Theobald explores the intersection of philosophy of science and finance. This followed an earlier series for Business Day Investors Monthly on the same theme. This column was first published in October 2014.
There is a romanticised stereotype of “quants” in the financial services industry. These savant-like individuals are thought to be supreme number crunchers, kept on retainer by banks and hedge funds looking to exploit anomalies in the market, and confined to back rooms where their genius is left uninterrupted.
The idea is that by crunching numbers the quants can pick up on correlations that others haven’t noticed. Those may lead to profitable trading strategies. “Data mining” as it is commonly called has been spurred on by the growth of big data – the masses of information accumulated on computers that has become increasingly analysable thanks to processor speeds.
But in case you think this is all a rather dark Orwellian world, here are some problems that quants have. Mining data can lead to spurious correlations. Tyler Vigen, a Harvard law student, has assembled some hilarious ones on a blog. A correlation coefficient shows just how closely two sets of data track each other. A correlation measure of 1 means there is a perfect linear relationship between two sets of data. Here are some of the correlations that Vigen has revealed: per capita consumption of cheese in the US with the number of people who died by becoming tangled in their bed sheets (coefficient of 0.95), the divorce rate in the state of Maine with per capita consumption of margarine in the US (0.99), US crude imports from Norway with drivers killed in collisions with railway trains (0.95). What Vigen is showing is that correlation does not prove causation. With so much data now being recorded it is easier than ever to find things that correlate with each other and easier than ever to make spurious claims about causation.
The problem is really one of prediction. We try to find correlations in order to understand how one variable is affected by another one. If we get that right it can be powerful. For example, we can create an equation that allows us to predict how inflation will respond to a move in interest rates. We can do it with just two bits of information: inflation and interest rates. In SA the correlation between the two is 0.62 based on the last 12 years’ data. But we may be able to get a better “fit” to previous data if we expand our equation to more variables. We could add a third such as GDP growth, or a fourth like employment, or a fifth such as capacity utilisation. There’s no limit to how many additional terms we can add.
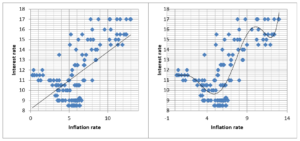
In theory, we can produce an equation that would fit absolutely any data set you like. I’ve done a rough illustration in the graphs here which both show SA interest rates and inflation over the last 12 years. The first is a simple linear regression of interest rates against inflation. The second is a regression but with six terms instead of two. The first fits the data pretty weakly while the second fits it much better.
But here’s the problem. It turns out that the more factors we add to our equation, and the better fit we get to historic data, the less capable our equation is at making predictions. You can see the idea from the two graphs. Looking the simpler graph one can imagine what interest rates would do if inflation rose to, for example, 15, by following the line. Seems you’d get an interest rate of about 16.5%. But looking at the more complex graph, it’s not that clear. It looks like interest rates shoot up at the higher level (in fact you can’t answer this question without the equations behind the graphs. I plugged the numbers and the equation told me an inflation rate of 15 would imply an interest rate of 547% – clearly ridiculous).
What does all this mean? One pretty clear result is that the quants are not as powerful as we think. It turns out that in many situations making the maths more complicated actually lowers the predictive power. For those of us who don’t get a thrill from manipulating statistics software, this is good news. In fact some psychologists argue that our own guesses about the future based on common sense understanding of information are more accurate than complicated equations.
The lesson for those of us in financial markets is this. Don’t let statistics overwhelm you or rely on the quant’s equations. Just ask simple questions about what the information reveals about what is going on in the real world. Chances are that will allow you to make better predictions than the guys in the back room.